More detailed graphs/charts

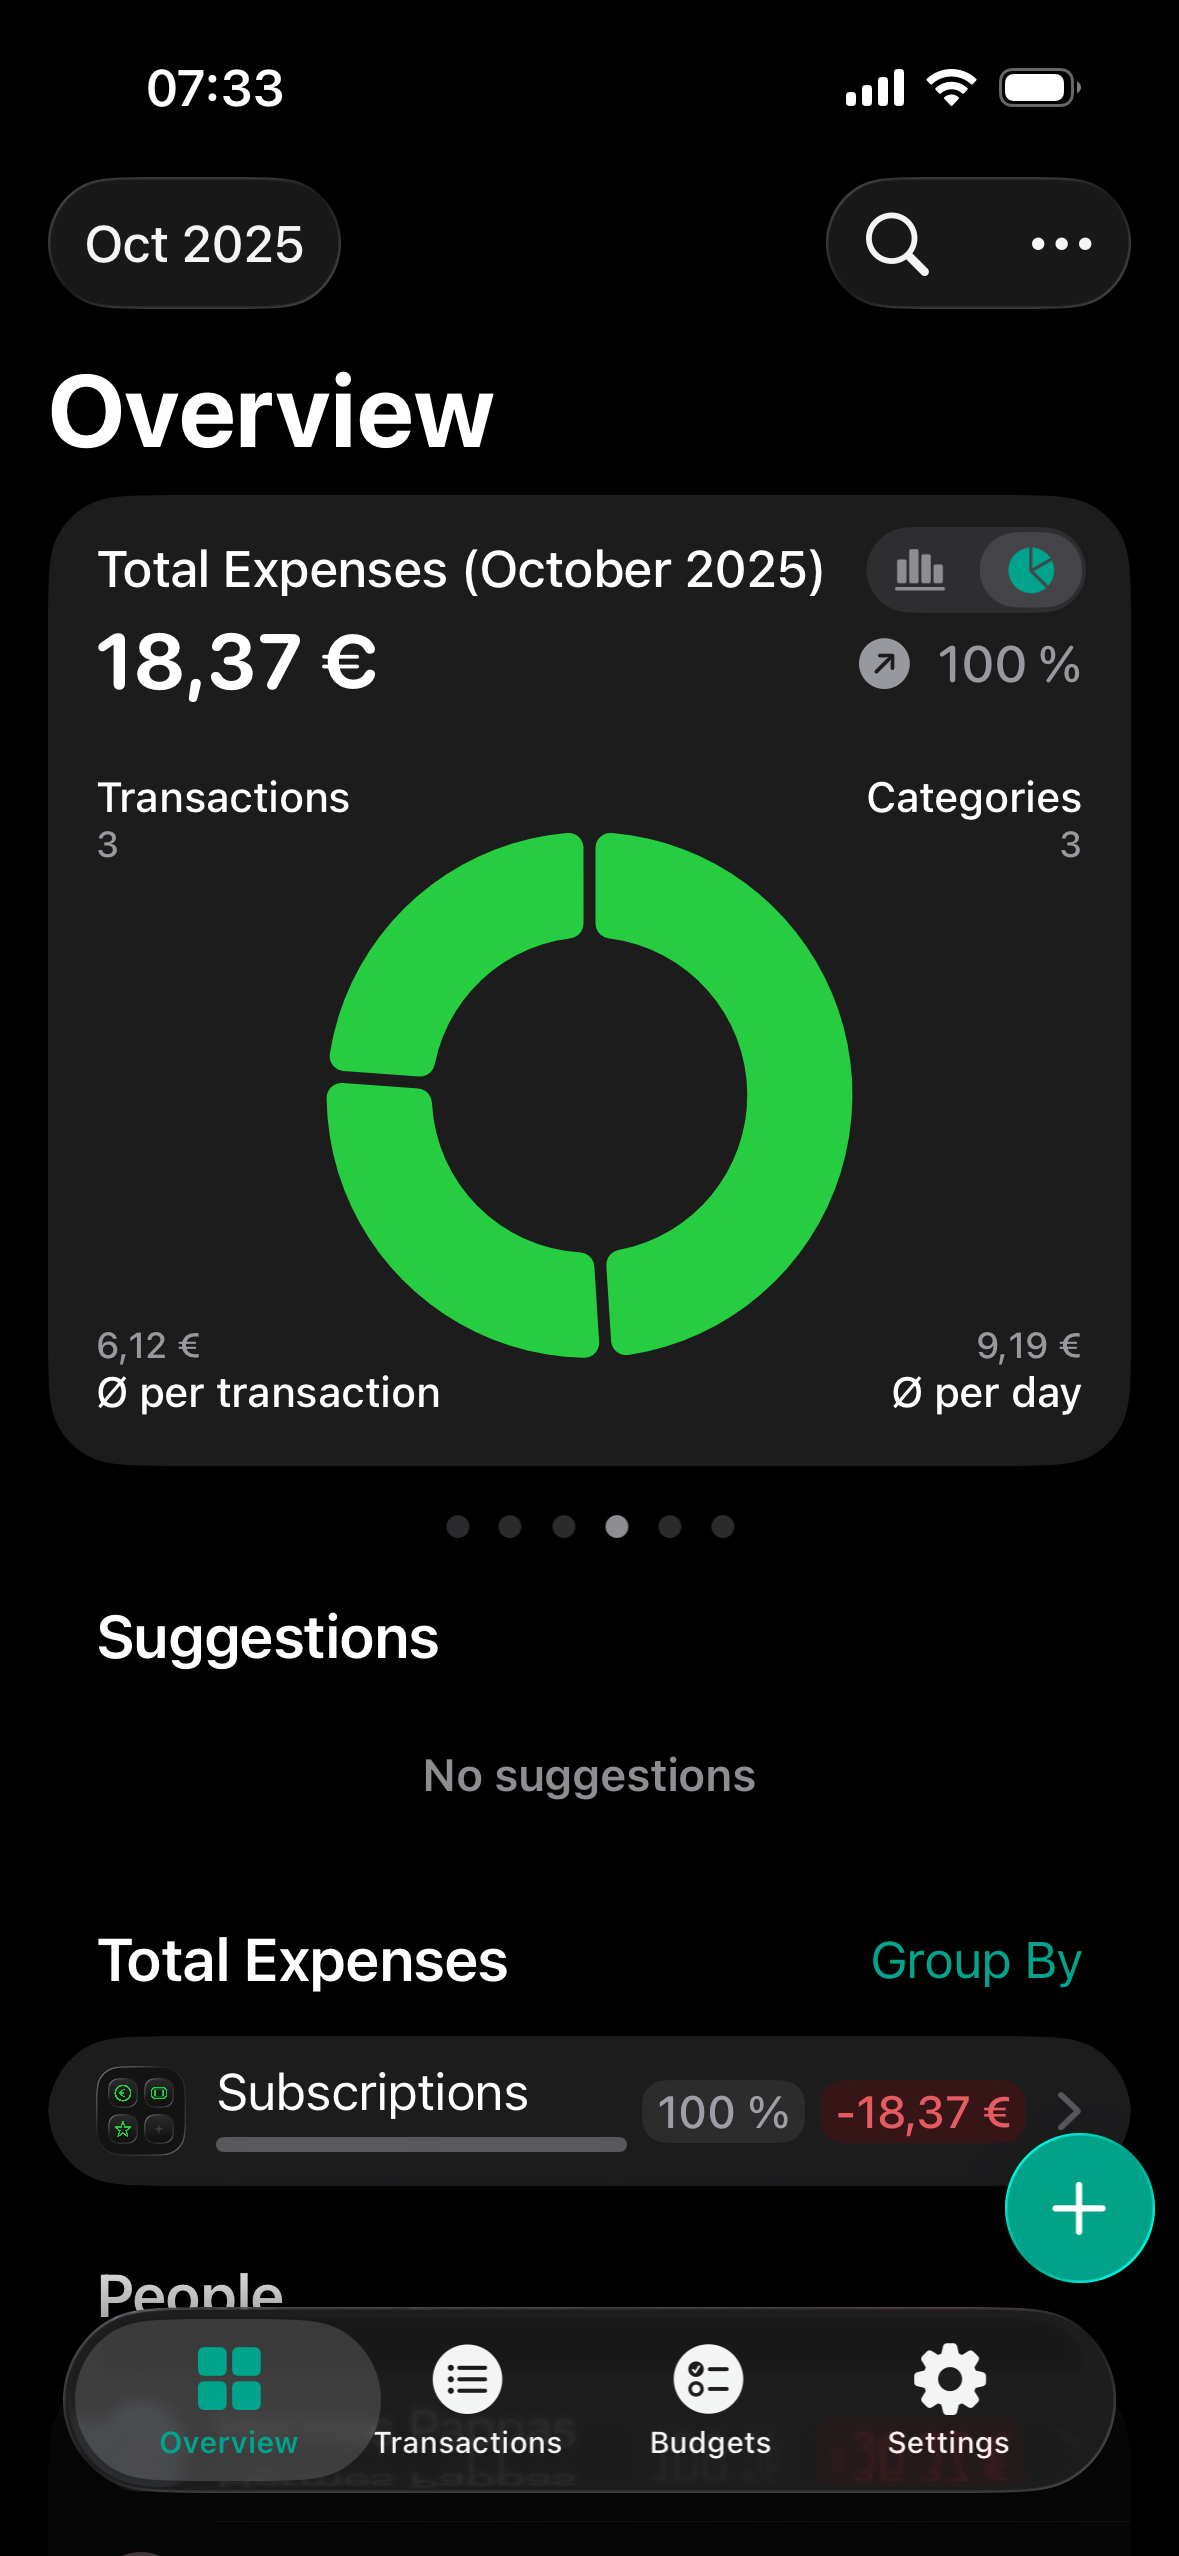
Upon seeing this chart, I instantly wanted to tap on it or its segments to see each category in more detail. It would also be good to be able to switch the charts between folder mode and category mode for more fine-grained detail or a more high level overview.
Log in to comment and vote
Comments1
Birosca
May 26
A complement to the suggested feature is:
1- to show details (expense category, amount and %) when hovering the mouse over any such category in charts.
2- create a chart type for entire groups of categories